- Tax-free growth and withdrawals
- Control over future tax exposure
- Efficient conversion pricing
- Simplified estate planning
It is a process that allows you to move funds from your previous employer-sponsored retirement plan, a 401(k), for example, into an IRA. When you roll over your old retirement account into an IRA, you can preserve the tax-deferred status of your retirement assets without paying current taxes or early withdrawal penalties at the time of transfer.
Follow our three-step process to roll over your old 401(k) or other employer-sponsored account into a Schwab IRA and take control of your retirement savings.
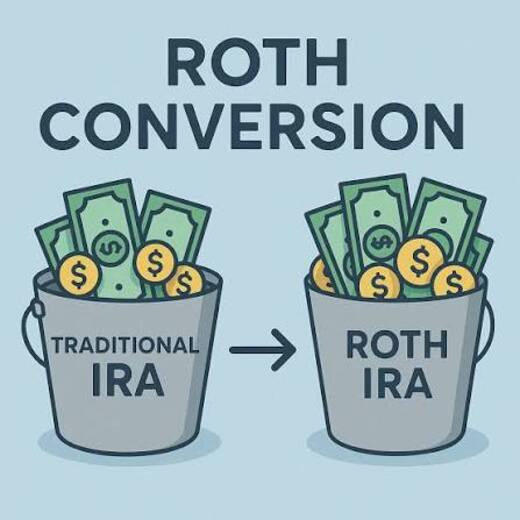
For many individuals, converting to a Roth IRA may make sense. However, you should consult with a tax advisor and consider the following factors prior to making your decision:
If so, a conversion may also make sense for you.
“Continuity should be one of the main factors when you look into investing with a financial advisor or wealth manager.”
Sander Read
President & Chief Executive Officer
31 Years Managing Wealth
“The big hurdle is the lack of support for recovering passwords, keys, and digital asset locations, making pre-planning crucial.”
Corey Roun
Sr. Director of Trading & Derivatives Strategies
15 Years with Lyons Wealth
“We have a fiduciary duty to always put clients’ interests first, we only do better, when you do better.”
Matt Ferratusco
Senior Portfolio Manager & Analyst
9 Years with Lyons Wealth
“Small-cap stocks offer big growth potential—we help you seize those opportunities with confidence and precision.”
Mark Zavanelli
Senior Portfolio Manager
5 Years with Lyons Wealth




At Lyons Wealth, we get to know our clients to understand their specific goals, objectives, needs, and future desires. We look for a good fit for everyone involved and want to engage in long-term relationships with the clients we advise. Our client roster ranges from:

“Working with Lyons has been amazing. The team is professional and communicative so I always know how my investments are doing.”
“Lyons Wealth Management helped educate me and allay my fears, as well as provided solid guidance on steps I could take to help me reach my goals even sooner.”
Schedule a call with a financial advisor to discuss the best strategy for you!
Disclaimer:
Past performance does not guarantee future results.
Subsequent markets may perform better or worse than for the periods shown, which will cause the actual results of a portfolio to be better or worse than shown. LIM does not guarantee or offer any assurance that any portfolio or account will be profitable, meet a client’s stated objectives, or prevent or reduce losses. A client may lose money by investing in a portfolio. Actual realized returns will depend on, among other factors, the value of assets and market conditions at the time of disposition, any related transaction costs, and the timing of the purchase. This is not a recommendation nor an offer to sell (or solicitation of an offer to buy) securities in the United States or in any other jurisdiction.
The Fundamental Small Cap Value Composite consists of accounts that hold U.S. small cap stocks selected by using LIM Fundamental Analysis. This analysis identifies undervalued companies using LIM’s GRAPES valuation model and applies other selection criteria relating to a company’s business prospects, management quality, and capital structure. The benchmark for the composite is the Russell 2000 Index, presented in U.S. Dollars. The Russell 2000 is a market cap weighted index of small company US stocks. In the past the composite has displayed higher volatility than its benchmark. Investing in small capitalization companies generally involves greater risk than investing in larger, more established companies. The S&P 500 is a market-capitalization weighted index of 500 leading publicly traded companies in the U.S.
The composite includes fully discretionary, management fee-paying and, beginning on January 1, 2011, non-management fee-paying accounts, including those accounts no longer with the firm. The U.S. Dollar is the currency used to express performance. Returns are presented net of management fees and include all trading expenses and the reinvestment of all income and dividends. Net of fee performance was calculated using model management fees, including for non-fee-paying accounts. The model fee is our current maximum fee of 1.5% per year for separately managed accounts which do not pay a performance-based fee. Actual advisory fees and transaction fees will vary depending on, among other things, the portfolio, account size, and activity. Fees are described in LIM’s ADV Part 2A.
On September 24, 2019, Lyons Investment Management acquired the asset management business which managed the composite presented. At the time of the acquisition LIM was affiliated with the prior firm with shared investment personnel. Performance shown prior to the acquisition date is from the prior firm. The historical performance has been linked to performance achieved at Lyons Investment Management.
The benchmark data provided was obtained from publicly available reports. LIM believes such data to be reliable but does not audit, verify, or guarantee its accuracy or completeness. When comparing the performance results to a benchmark, clients should keep in mind that: 1) Indexes are unmanaged and unavailable for direct investment. 2) Benchmark returns include reinvestment of income, but do not reflect taxes, or investment advisory or other fees that would reduce performance. 3) Performance information of benchmark indexes is included for comparison purposes only. 4) Indexes and benchmarks may not directly correlate or only partially relate to the composite.
Lyons Investment Management, Inc. (“LIM”) is an SEC registered investment adviser managing separate accounts that are fully discretionary. SEC registration does not constitute an endorsement of the firm by the Commission, nor does it indicate that the adviser has attained a particular level of skill or ability
The Morningstar RatingTM for separate accounts, commonly called the star rating, is a measure of a separate account’s risk-adjusted return, relative to other separate accounts in the same Morningstar Category. Separate accounts are rated from 1 to 5 stars, with the best performers receiving 5 stars and the worst performers receiving 1 star. Separate accounts are rated for up to three periods (three, five, and 10 years), and ratings are recalculated each quarter. The Morningstar Rating for separate accounts uses an enhanced risk-adjusted return measure, which accounts for all variations in a separate account’s monthly performance, with more emphasis on downward variation. Separate accounts are ranked against others in the same category and stars are assigned as follows: Top10% 5 stars, Next 22.5% 4 stars, Middle 35% 3 stars, Next 22.5% 2 stars, Bottom 10% 1 star.
© 2023 Morningstar, Inc. All rights reserved. The information contained herein: (1) is proprietary to Morningstar and/or its content providers; (2) may not be copied or distributed; and (3) is not warranted to be accurate, complete, or timely. Neither Morningstar nor its content providers are responsible for any damages or losses arising from any use of this information.
5 Star Overall RatingTM out of 158 small value funds as of 03-31-24. Compensation was provided for the display of this rating.